Choosing the right investment strategy is imperative to ensuring steady returns amid an economic downturn. A small change in approach can make or break an equity portfolio.
Along with ‘What to Buy’, you must know ‘When to Buy’.
Here are the top 5 strategies you can use.
- Buy the stock only when RSI crosses above 30 levels.
(Success Rate: 90%)

Relative Strength Index (RSI) : The Relative Strength Index (RSI), developed by J. Welles Wilder, is a momentum oscillator that measures the speed and change of price movements. The RSI oscillates between zero and 100. Traditionally the RSI is considered overbought when above 70 and oversold when below 30. Signals can be generated by looking for divergences and failure swings. RSI can also be used to identify the general trend.
2. Use the combination of 9 Day EMA and 21 Day EMA for most profitable trades.
(Success Rate: 85%)
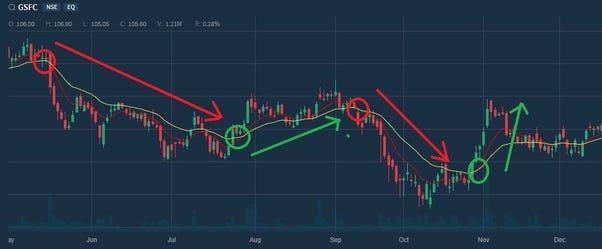
EMA: Exponential Moving Average (EMA) is similar to Simple Moving Average (SMA), measuring trend direction over a period of time. However, whereas SMA simply calculates an average of price data, EMA applies more weight to data that is more current. Because of its unique calculation, EMA will follow prices more closely than a corresponding SMA.
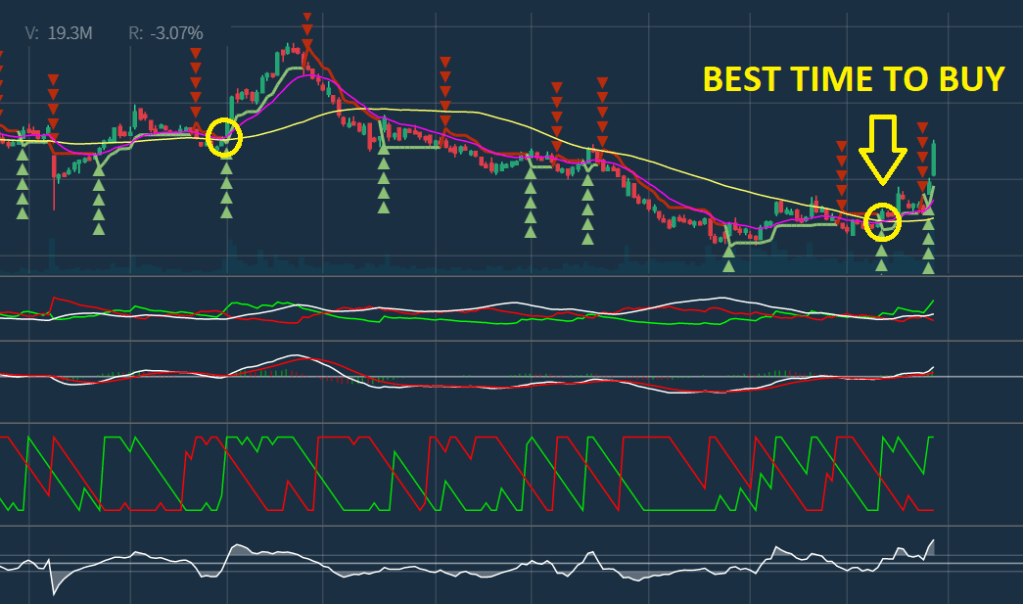
3. Always use MACD to identify the trend.
(Success Rate: 90%)

MACD :
The Moving Average Convergence/Divergence indicator is a momentum oscillator primarily used to trade trends. Although it is an oscillator, it is not typically used to identify over bought or oversold conditions. It appears on the chart as two lines which oscillate without boundaries. The crossover of the two lines give trading signals similar to a two moving average system.
The signal line is a 9-day EMA of the MACD line. As a moving average of the indicator, it trails the MACD and makes it easier to spot MACD turns. A bullish crossover occurs when the MACD turns up and crosses above the signal line. A bearish crossover occurs when the MACD turns down and crosses below the signal line.
4. Use Bollinger Bands to identify the ‘Bounce Back Price’ to get in.
(Success Rate: 60%)
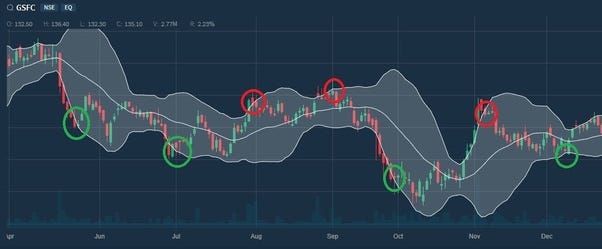
Bollinger Bands : Bollinger Bands are a type of price envelope developed by John Bollinger (Price envelopes define upper and lower price range levels.) Bollinger Bands are envelopes plotted at a standard deviation level above and below a simple moving average of the price. Because the distance of the bands is based on standard deviation, they adjust to volatility swings in the underlying price.
5. For 90% successful trades, use Death Cross and Golden Cross.
(Sucess Rate: 95%)


See detailed analysis about Death and Golden Cross here
A Brief about Technical Analysis: The technical analysis comprises of Candlestick charts, different indicators to find out the stock current trend, entry points, and exit points. Different strategies and indicators for daily trade mechanism.
You can learn complete Technical Analysis in 15 days here
The investor should have an appropriate understanding of risks, both implicit and explicit: Perhaps investors can best prepare themselves to manage their money efficiently and build their net worth by getting a firm grasp of financial history. Investors can also acquire an understanding of the human psychology that influences the buying and selling decisions of individuals. This will improve their chances of avoiding mistakes that could impair their wealth-building process.
You can learn it here Technical Analysis
Technical Analysis is also an important component of disciplined trading. Discipline helps mitigate the nemesis of all traders, namely, emotion. As soon as you have money in the market emotionalism is in the driver’s seat and rationale and objectivity are merely passengers. If you doubt this, try paper trading. Then try trading with your own funds. You will soon discover how deeply the counterproductive aspects of tension, anticipation, and anxiety alter the way you trade and view the markets–usually in proportion to the funds committed.
Technicals can put objectivity back into the driver’s seat. They provide a mechanism to set entry and exit points, to set risk/reward ratios, or stop out levels. By using them, you foster a risk and money management approach to trading.
For example, if you are interested to invest in Tata Motors for the long term and you are searching for a time to enter then instantly open the chart and get the answers in seconds.
(Tata motors surged 40% in last 5 days.) (As on 29/10/2019)
A short-term trader that uses technical places the capital on risk only in the presence of opportunities but otherwise preserve it. Trading stocks on the basis of technical analysis allow the trader to maximize profits while simultaneously limiting risks by following a solid plan of action.
Suggestion: Never use high brokerage demat account as your quick profits will be eaten by them. Use zero brokerage demat account.
I personally use Upstox because of its interactive interface. You can open free demat in Upstox here
Akshay Seth
invest@equityboxx.com
Linkedin: www.linkedin.com/in/akshay-seth-1b7a1668
Hire a personal SEBI Registered advisor for your portfolio: Know more
Let the advisor design your Stock Portfolio for the Long term:Know more
Get daily stock recommendations here
Learn Stock analysis via video lectures here